Measuring Prison Overcrowding in California
Posted on January 07, 2018 in blog
California has long had a prison overcrowding problem - the issue has been the subject of a number of lawsuits since the 1990s. Coleman v. Schwarzenegger began in 1990, Plata v. Schwarzenegger followed in 2001 (and later consolidated with Coleman in 2007), and Brown v. Plata reached the US Supreme Court in 2011. See the "Further Reading" section at the end of this post for more detail on those cases.
The Supreme Court affirmed that overcrowding was the “primary cause” for violations of the Eighth Amendment (cruel and unusual punishment), and ordered California to come within 137.5% of their prison system’s designed capacity within two years. At the time of the decision in May of 2011, California’s state prisons were housing 175.2% of their designed capacity, according to the CDCR.
There is obviously a lot to unpack about this decision and the reforms put into place since 2011 - but in aggregate, overcrowding has decreased. At the end of December 2017, the CDCR reported that its prisons were now housing 131% of their designed capacity, therefore meeting the number mandated by the court. But it’s worth taking a step back and asking: Is looking at aggregate data (i.e. the total number of people in all California prisons combined vs. the total capacity of all 35 prisons combined) the correct way to measure overcrowding?
December 2017 - not “technically” overcrowded
Based on the ruling discussed above, the basic idea is: there’s an overcrowding in California prisons, and 137.5% of the designed capacity is an upper bound on how much overcrowding is constitutionally permittable.
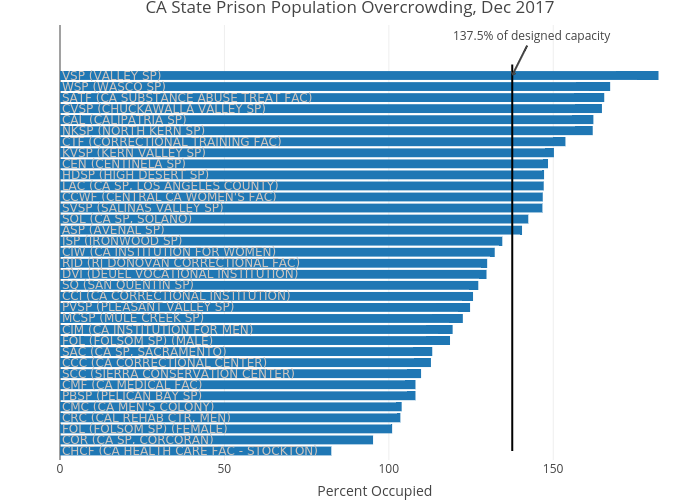
The problem is that California state prisons are not one single entity; there are currently 35 different state prisons. If 137.5% is the standard for “overcrowding” that violates the 8th Amendment, then each of the prisons should have less than 137.5% of their designed capacity. That, however, is very much not the case today. As of December 31, 2017, 15 out of 35 (43%) of California state prisons still house over 137.5% of their designed capacities, according to the CDCR. Taken together, these 15 prisons are housing almost half of all people in California state prisons today. The total number of people in the 15 overcrowded prisons is 58,591 out of a total 118,058 state-wide - or 49% of the state prison population. If 49% of the state prison’s population is still living in a prison that exceeds the court’s threshold of 137.5%, then the people in those prisons are still at risk for the same health issues that have long plagued California's overcrowded prisons - that's a problem, even if the aggregate population is 131% of the total capacity of all prisons combined.
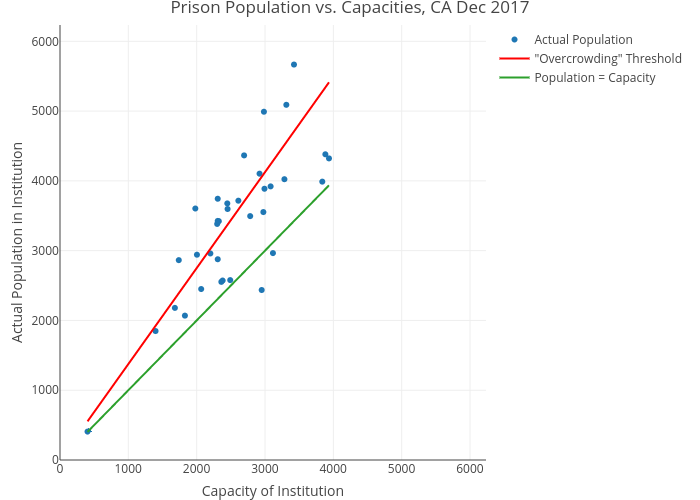
To get an idea of the designed capacities and actual populations, the following scatterplot compares capacity and actual population for each CA state prison, at the end of December 2017. The green line shows what would happen if each prison housed its exact capacity; the red line shows the 137.5% "overcrowding" limit that the court defined.
An example of why aggregates don't work
To illustrate why using the aggregate state capacity as a measure of "overcrowding" is problematic, consider this example. Say we have five prisons: A, B, C, D, E. Each has a designed capacity of 100. In total, assume there are 600 people in prison. Looking at the state as a whole, the prisons are handling 120% of their capacity (600 total / 500 designed capacity) - that number is below the defined threshold of 137%. This number, however, doesn't take into account the distribution of overcrowding, as the below example demonstrates.
Scenario 1 - Skewed distribution
- A: 100 people
- B: 100 people
- C: 100 people
- D: 100 people
- E: 200 people
In this example, there are still 600 people in total. Prisons A - D are at exactly their designed capacity, but Prison E is operating at 200% of its capacity. This would clearly be problematic for the health and basic rights of people in Prison E, but the aggregate overcrowding measure would still define this as being an "acceptable" state of 120%.
What most people probably think of when they think of 120% is a more balanced distribution, where each prison has roughly the same amount of overcrowding. That kind of distribution would look like the following.
Scenario 2 - Uniform distribution
- A: 120 people
- B: 120 people
- C: 120 people
- D: 120 people
- E: 120 people
This is arguably a better situation, since no people are living in conditions that exceed the 137% threshold.
Alternative measures of overcrowding
As we've seen above, looking at the total number of people in state prisons and the combined capacity of all prisons can be a problematic way to measure overcrowding. Such a definition doesn't take into account the distribution of overcrowding in every single prison. Can we come up with a better way?
Number of people in prisons that exceed 137%
Recall that the original problem is that prisons with populations exceeding 137% of their designed capacity threaten the health and basic rights of people in such prisons. We could therefore simply look at the number of people in such prisons, and divide that by the entire state's population - in that case, we're defining what percentage of people in prison are living in conditions that threaten their health and basic rights.
- Scenario 1 - 33%
Prison E is the only one which exceeds 137%. Since it holds 200 people out of a total of 600 people, there are 200 people living in overcrowded prisons / 600 people in total = 33%.
- Scenario 2 - 0%
All five prisons have fewer than 137% of their designed capacity, so this metric would be 0 / 600 = 0%.
The problem with this metric is that it classifies each prison as "overcrowded" or not; a decrease in just a few people would cause this metric to change drastically. For example, if Prison E had 138 people (with a designed capacity of 100), it would be considered "overcrowded", and all 138 would count towards this measure. If that number decreased to 136, then the prison would no longer be defined as "overcrowded," and this measure would drop to zero. Ideally, a good measure of overcrowding would change in a smoother fashion.
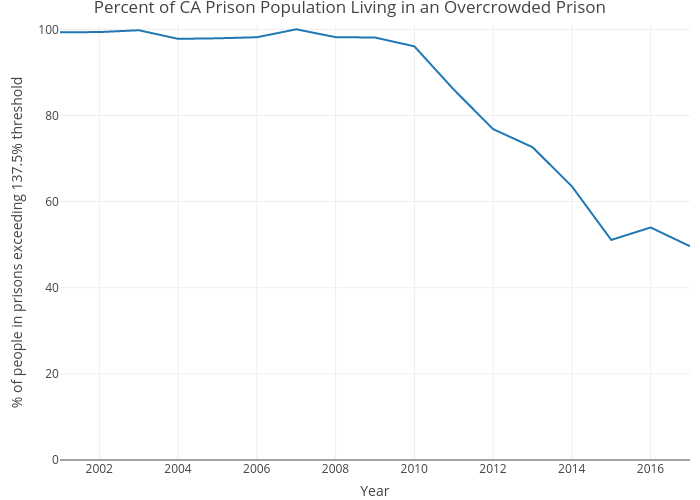
The graph below shows this metric used on real data in California. Although it is not a perfect way to measure overcrowding, it does reveal that almost half of the people in California's state prisons are still living in overcrowded conditions.
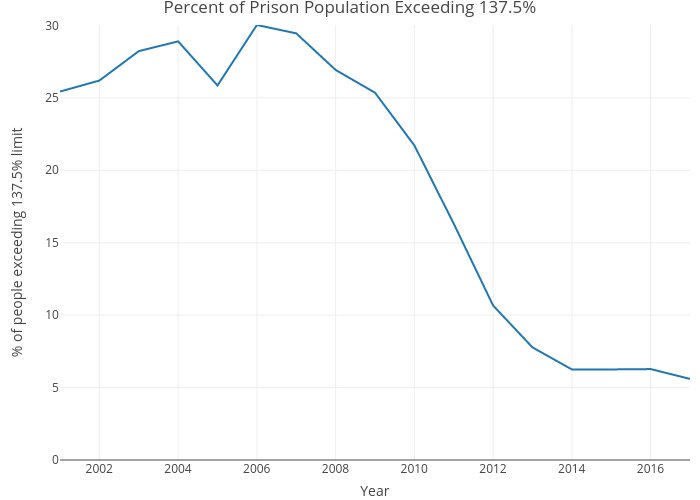
Number of people exceeding 137%
Rather than counting the entire population of a prison if it exceeds its "overcrowding" limit, we would instead measure the "gap" between the current population and the defined threshold. If the prison has a capacity of 100 people, an overcrowding limit of 137, and 200 people in it, then this metric would be 200 - 137 = 63 people. If 63 fewer people were in this prison, then it would no longer be defined as overcrowded.
- Scenario 1 - 10.5%
Prison E is the only one which exceeds 137%. It has a total of 200 people, which is (200 - 137) = 63 people above the "overcrowding" threshold of 137%. Therefore this measure would be 63 / 600 = 10.5%.
- Scenario 2 - 0%
All five prisons have fewer than 137% of their designed capacity, so this metric would be 0 / 600 = 0%.
This is a bit of an improvement over the previous measure, because it decreases continuously as a prison's population decreases.
Conclusion
Prison overcrowding in California has gotten better since 2011, but remains extremely problematic. The way that we (or the courts) define "overcrowding" is very important - it's the number that the state of California will optimize for. Using an aggregate measure doesn't account for the distribution of overcrowding, and can leave people in certain prisons in unsafe, unhealthy conditions. With that said, I fear that the courts would be unlikely to consider such alternatives that are slightly harder to understand - as FiveThiryEight recently noted, the Supreme Court is generally not open to thinking mathematically. The suggestions given above are just two possibilities - there are certainly others that may do a better job. If readers have other ideas, I would be very interested to hear them!
The code used to analyze these data and create the above plots can be found on Github.
A note on the data
Each month, the CDCR provides a snapshot of their prisons' populations - each month is a separate PDF, and they are archived here. I wrote a tool to parse these monthly PDFs and output a CSV, making it much easier to look at population trends over time - the scripts and data are available on Github.
Further reading
This post was meant to explore specifically how overcrowding is measured, and how that affects people. There is a lot more context on prison overcrowding in California and the reforms taken since the 2011 ruling of Brown v. Plata - they warrant much more detail than I've provided here. Here are a few resources for people interested:
- Jonathan Simon's Mass Incarceration on Trial provides a fantastic and detailed overview of these cases.
- Some of the faculty at UC Hastings maintain a blog on the state of California criminal justice policy and reform - they provide a ton of detail, written in a readable way (as someone without a law background, I was able to understand a lot of it). You can view their posts on the topic of prison overcrowding - the blog is mostly maintained by Hadar Aviram.
- "Realignment" was one of the main initiatives (passed in 2011) started to address the overcrowding problem - the basic idea was to shift people charged with certain "low level" felonies from state prisons to county jails. The Public Policy Institute of California gave a good overview of Realignment and its impact as of 2015.
- Prop 47, passed in 2014, reclassified a number felonies to misdemeanors.
- Prop 64 , passed in 2016, legalized recreational use of marijuana.
Why 137.5%?
The 137.5% number was a compromise - the original plaintiffs requested a cap of 130%, but a "Corrections Independent Review Panel" was assembled to determine the "operable" capacity. That Panel determined that 145% of "designed capacity" was still "operable" - see their full report for more detail. The three judge panel that ruled in favor of the mandated reduction clarified the difference between "designed capacity" and "operable": "Notably, however, operable capacity does not take into account the space required to provide medical and mental health care" on page 41 of their opinion from 2009. Clearly the state of California was not prioritizing the health of its people when designing its prisons.